
SEO
How SigNoz Improved Its US Organic Traffic Trajectory by 77% in 3 Months
1. At a glance
77% | 15.4% to 3.5% | 14.7% to 3.4% | 3 months |
SigNoz already had a deep organic footprint across observability, OpenTelemetry, log management, APM, comparisons and developer content. The problem was not a lack of pages. Organic traffic had been falling for months, and a large content footprint meant that fixing URLs one at a time would only go so far.
From April to June, the focus was to change the trajectory: organise SEO around the right categories, strengthen existing pages, improve how related content worked together, reduce cannibalisation and clean up technical issues that could hold performance back.
2. The challenge
SigNoz had hundreds of pages and strong topical depth. That scale also created complexity. Similar search intents could be spread across multiple URLs, some important categories had more complete coverage than others, and related pages were not always supporting one another as well as they could.
A quick traffic spike was never the goal. The first job was to slow the decline, make the existing site work harder and rebuild a base from which growth could return.
3. The Revenify approach
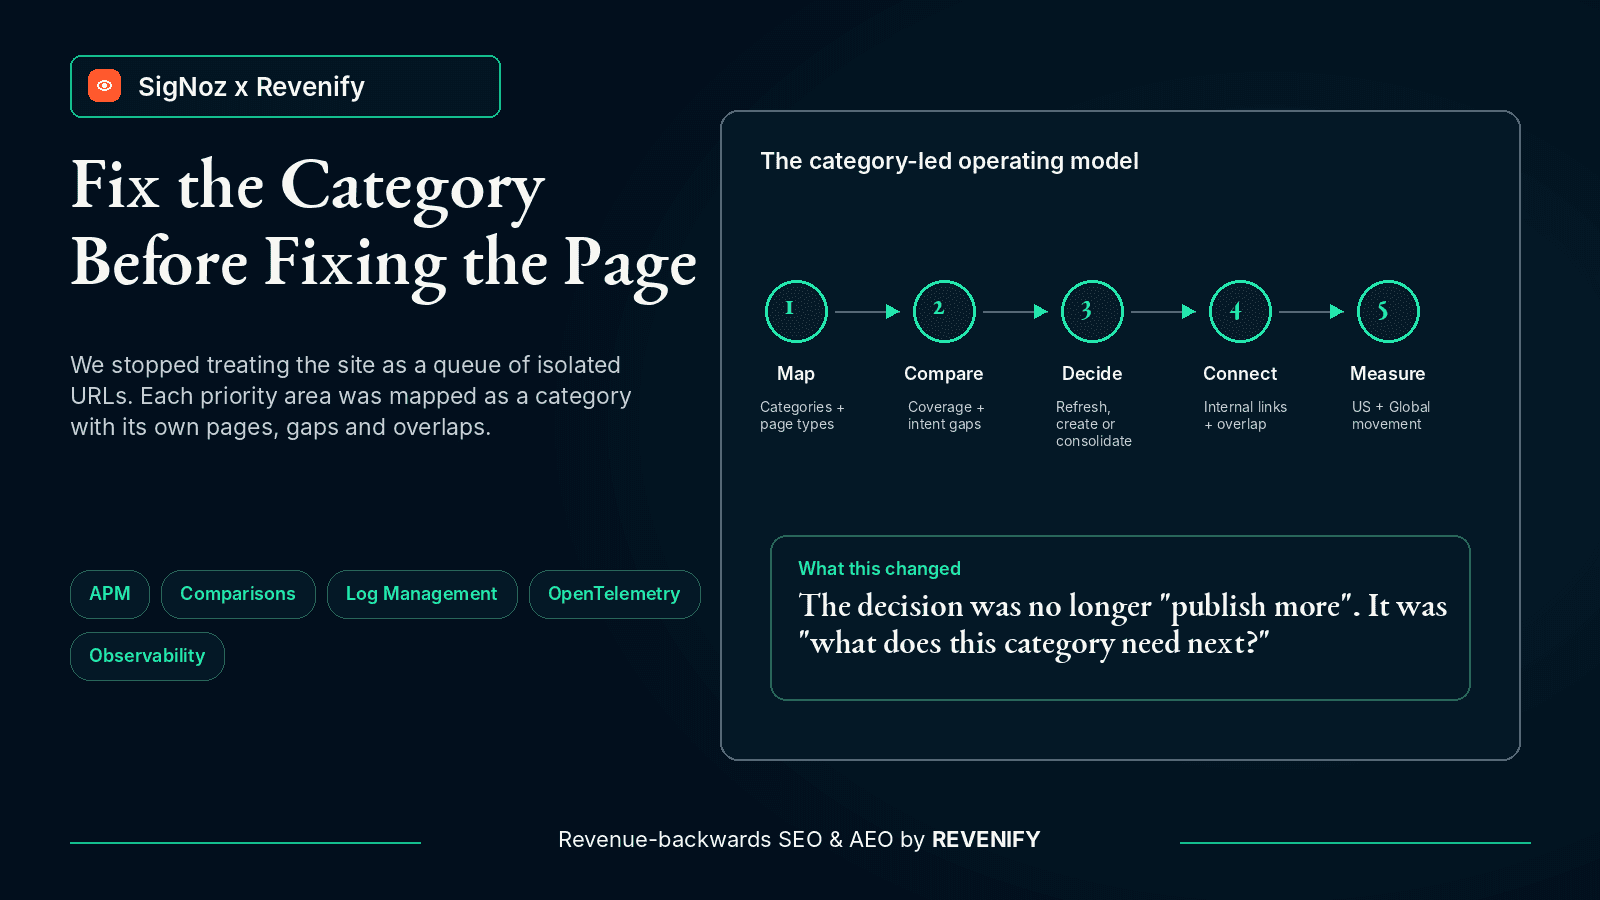
We changed the unit of planning from the page to the category. Instead of asking "Which URL should we update next?", we started with "Which category needs work, and what does it need?"
• Mapped core categories and page types so the site could be evaluated as connected topic areas.
• Refreshed the topic universe across priority categories and benchmarked coverage against the competitive landscape.
• Lightly refreshed existing pages where better intent alignment, structure or topical depth could help.
• Improved internal linking and addressed cannibalisation where multiple URLs were competing for similar intent.
• Ran technical SEO cleanup in parallel and tracked US and Global movement weekly and monthly.
Fix the category before fixing the page.
4. The US trajectory improved month after month
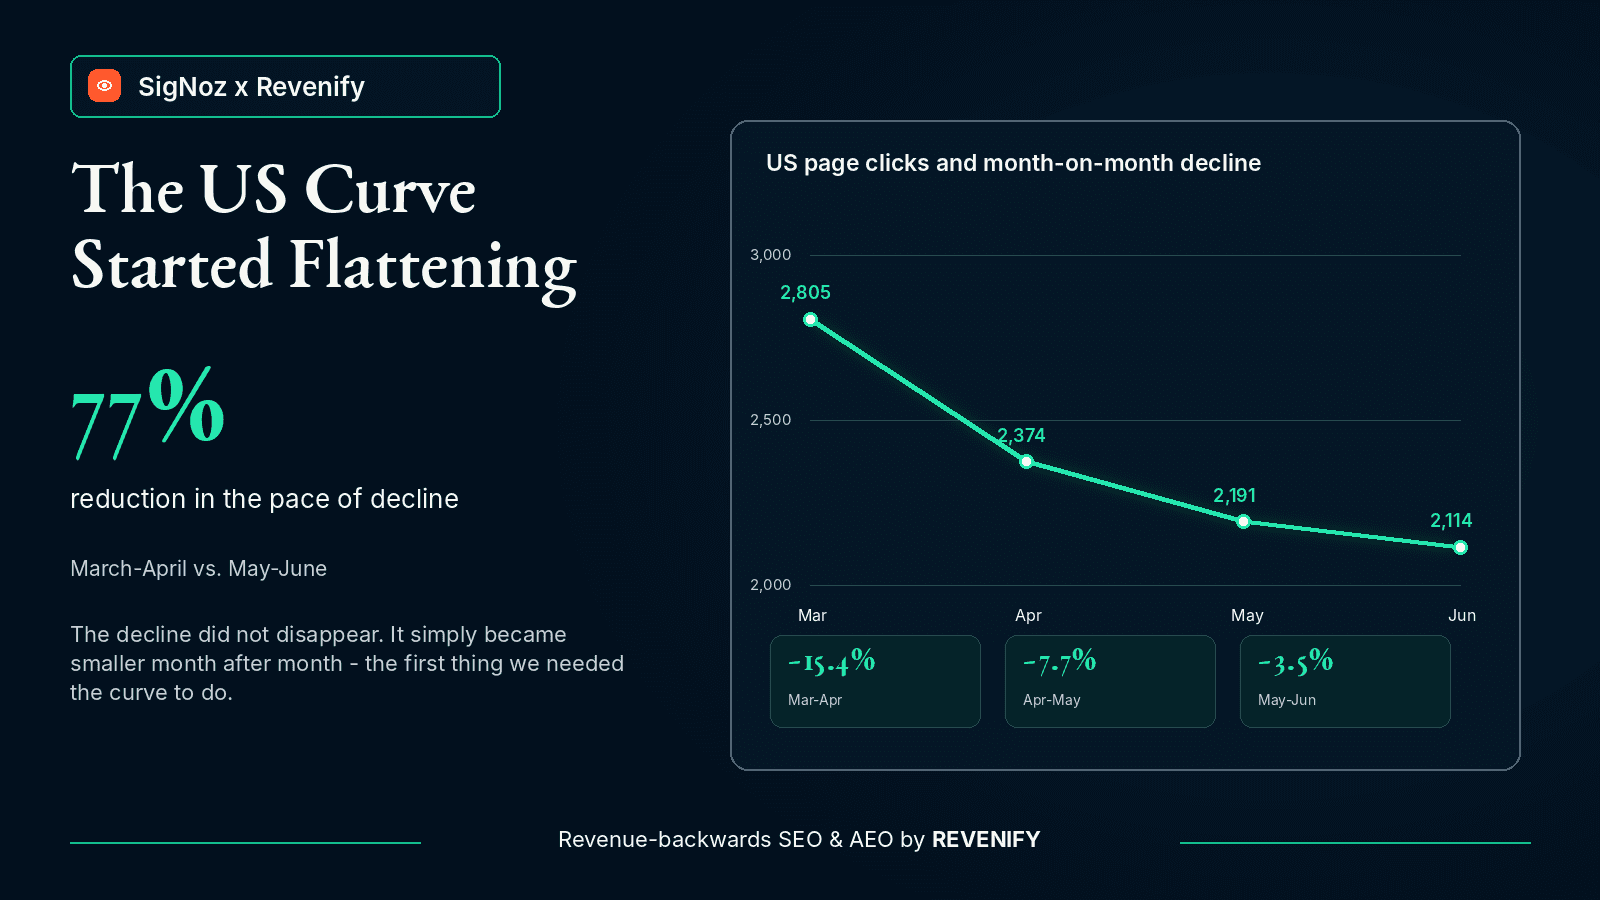
The clearest early result appeared in the US. Page clicks fell 15.4% from March to April. The decline then narrowed to 7.7% from April to May and 3.5% from May to June.
That is a 77% reduction in the pace of decline between the first and last monthly movements. Traffic had not fully recovered, but the curve was doing what we needed first: falling much more slowly.
5. Global performance was bumpier, but June moved in the same direction
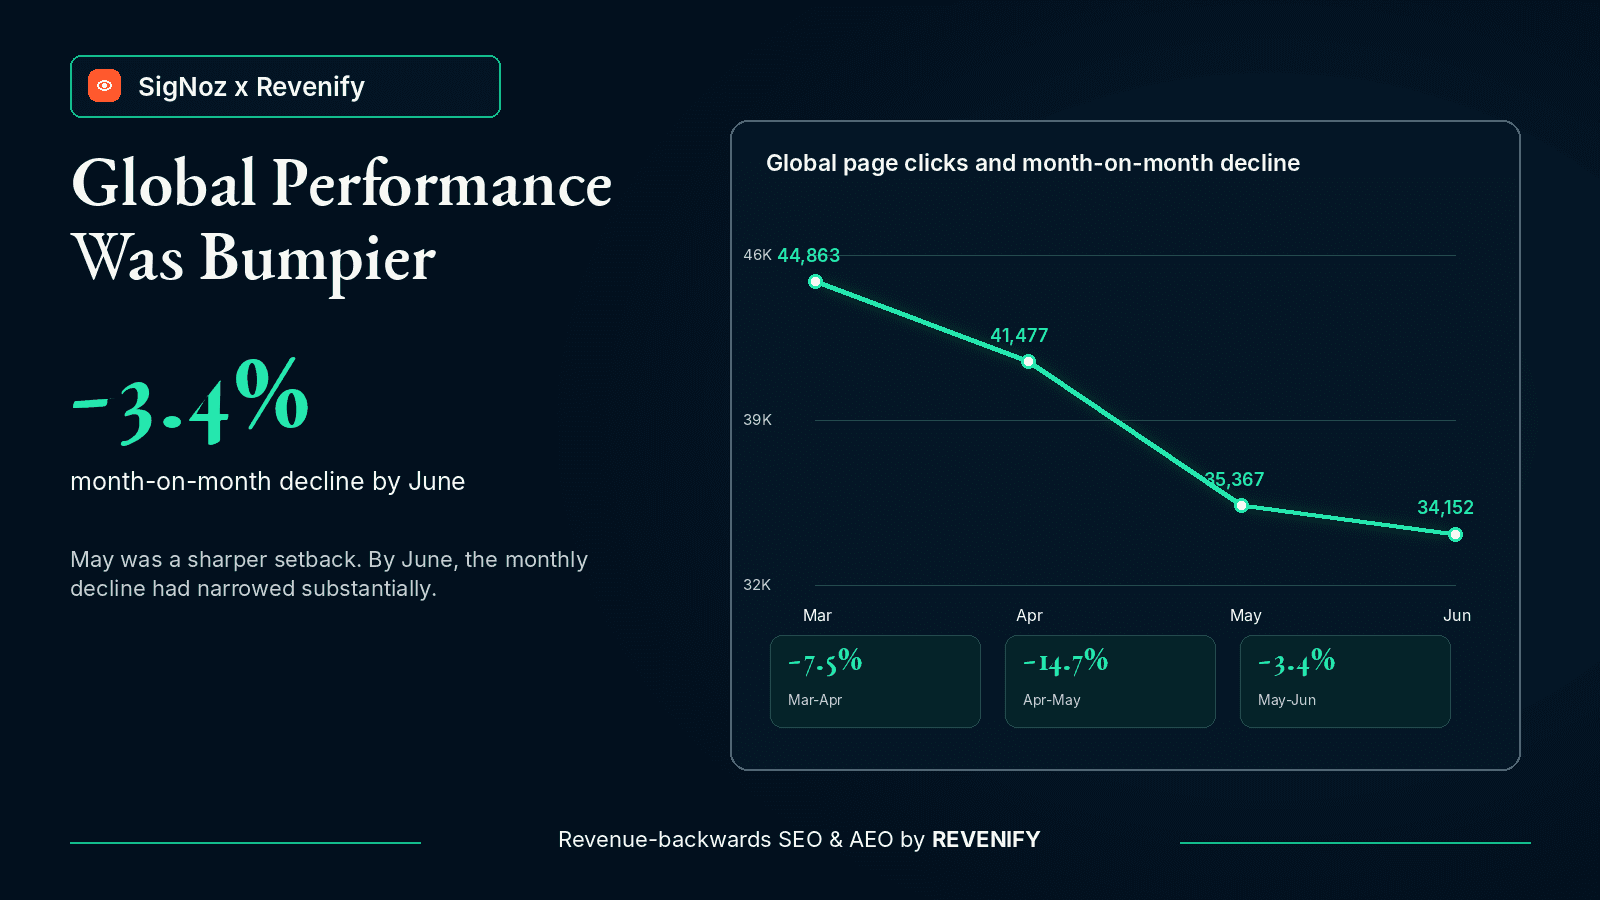
Globally, the path was less linear. Page clicks declined 7.5% from March to April and 14.7% from April to May. By May to June, however, the monthly decline had narrowed to 3.4%.
The June movement did not mean the turnaround was complete. It did show that the sharp May decline was not continuing at the same pace.
6. The strategy started at the category level
We first mapped SigNoz's footprint against the wider observability search landscape, including Datadog, Grafana, New Relic, Better Stack, Last9 and Dash0. The aim was not to create another giant keyword-gap list. It was to see where SigNoz needed more depth, where it already had enough content and where existing pages were overlapping.
That gave us clear focus areas such as APM, Comparisons, Log Management, OpenTelemetry and Observability. For each category, the next action could be different: refresh an existing page, create something genuinely missing, improve internal links, consolidate overlap or simply leave a page alone.
7. We strengthened what already existed before adding more
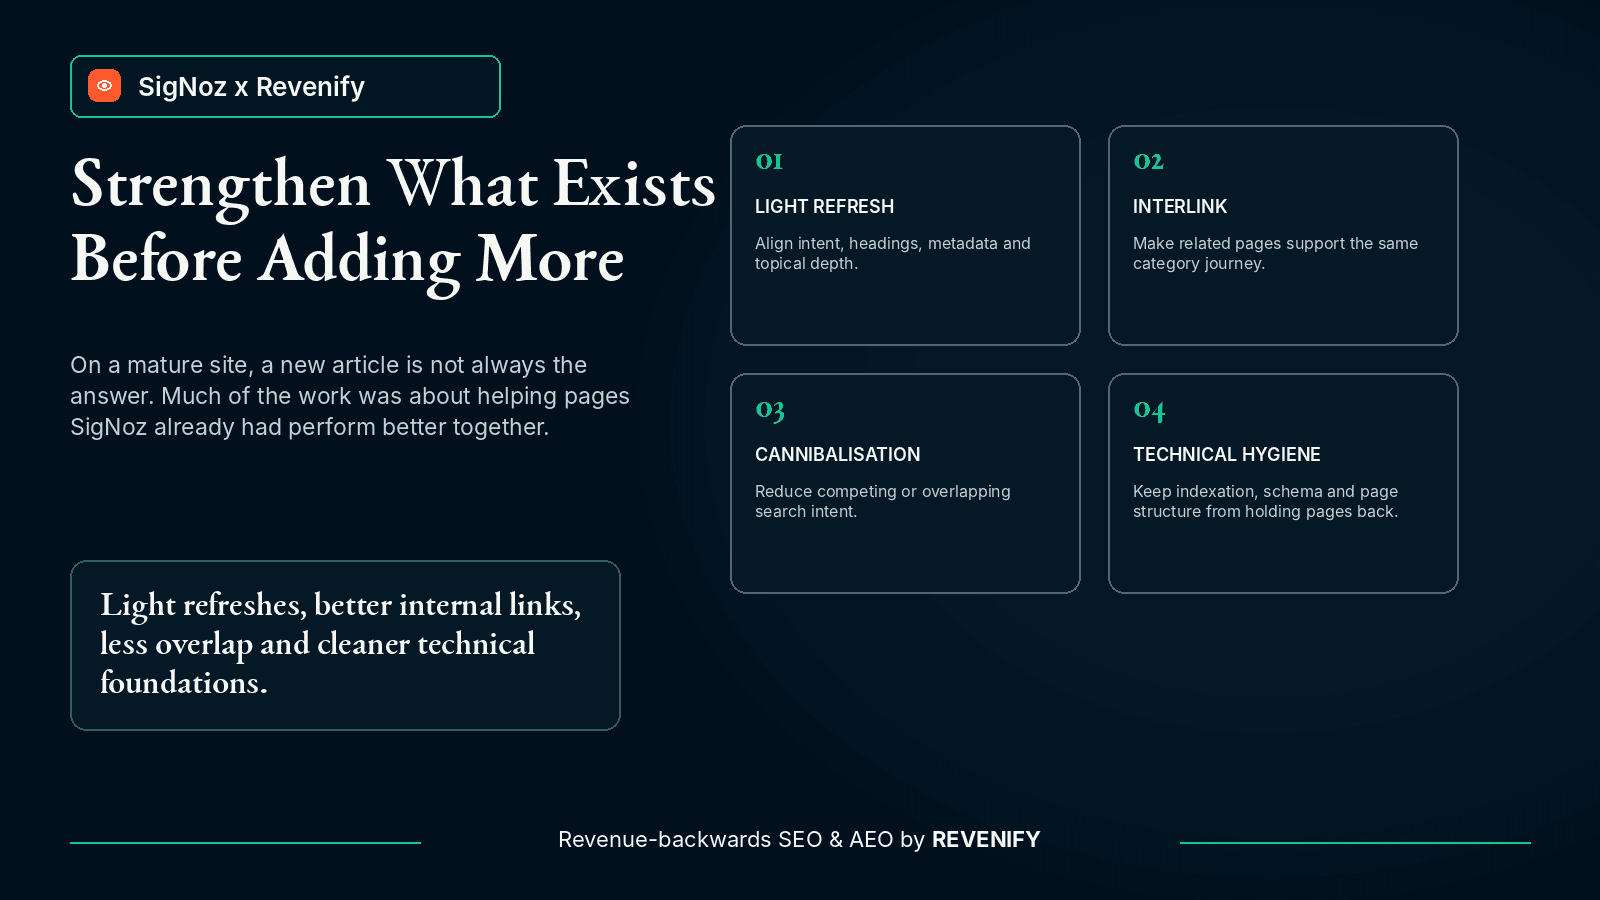
On a mature site, more content is not automatically better. A meaningful part of the work was about getting more from pages SigNoz had already built authority around.
Many pages needed a light refresh rather than a rewrite: clearer intent alignment, stronger headings and metadata, better topical coverage or more useful internal links. Cannibalisation and technical fixes were handled alongside the content work, not as separate exercises.
The aim was simple: make related pages work together instead of competing or operating in isolation.
8. The impact
Over three months, the pace of the US traffic decline improved by 77%, moving from 15.4% in March-April to 3.5% in May-June. Globally, the monthly decline also narrowed to 3.4% by June after a much sharper 14.7% movement in May.
The work did not produce a sudden V-shaped recovery, and that is not the claim. It changed the direction of travel while moving SEO from reactive page fixes to a more structured, category-led system.

SEO turnarounds do not always start with a spike. Sometimes the first win is simply making the curve stop falling so fast.
Contact
Let’s talk about growing your revenue, not just your traffic.
Exploring SEO, fractional help, or an audit? Let’s talk.